January is the worst. No beer, no sugar, no carbs. It’s cold outside. So naturally, friends during the winter text about baseball trivia. Life it often does, that turned into looking up 90’s relief pitcher David Weathers’s career stats. Weathers had phenomenal luck. He appeared in 2 games for the 1992 Blue Jays and 11 games for the 1996 Yankees. Just 13 appearances, 2 championships.
Weathers also played for the 2001 Cubs, who featured Jon Lieber going 20-6 that year. I had forgotten this fact and thought, “Who does Jon Lieber think he is winning 20 games?” Is his 20-win campaign of 2001 the worst 20-win season since 1996? I just had to find out.
(Note: I ponder most baseball topics relative to 1996. It matters baseball-wise because it was post-strike and I think the game changed then. 1993 baseball was nothing like today, but I think 1996 baseball is much closer. And the Bulls won 72 games, 6th grade was a helluva year, Recovering The Satellites came out and I played on a Little League team that went 20-1. 1996 rules.)
Consider these items about Joe Lieber’s 20-6 season with the Cubs in 2001 (34 starts):
- Lieber had a 4.51 ERA when the Cubs scored 6 or more runs – he had run support.
- Lieber went 12-1 at home and the Cubs scored 5.4 runs per game when he started (compared to 4.6 runs per game in the other 128 games).
- Sammy Sosa was on his team: In Lieber’s 34 starts that year, Sosa hit .309 with 11 HRs and 33 RBIs and walked 24 times.
Another fun fact: Lieber was the winning pitcher for the Cubs’ 10,000th win and the losing pitcher for the Phillies’ 10,000th loss.
It was his only all-star season and only top 15 Cy Young finish. His career ERA+ is 103, meaning he was about 3% better than the average pitcher. But where does his outlier season rank among the worst 20-win seasons since 1996?
20-Game Winners Since Troublesome ’96
Tupac wasn’t in the Billboard top 5 at the start of the 1996 baseball season, but you can find that list here. And that’s where we begin: You can find the list of American League 20-game winners here and the National League 20-game winners here. I then looked at these lists and focused on the 20-game winners since 1996 and evaluated them by advanced metrics WAR, FIP, ERA+, WHIP and K% – BB%.
Below is the list of pitchers who have won 20 games in a season since 1996. By looking at those 5 advanced metrics, I placed the seasons into tiers: dominant green, normal and mediocre red.
Here’s the list of AL 20-game winners:
| PITCHER NAME | TEAM | SEASON | W-L RECORD | WAR | FIP | ERA+ | WHIP | K% – BB% | |
| Andy Pettitte | Yankees | 1996 | 21-8 | 5.6 | 4.08 | 129 | 1.362 | 9.7 | |
| Pat Hentgen | Blue Jays | 1996 | 20-10 | 8.5 | 3.94 | 156 | 1.250 | 7.5 | CY |
| Roger Clemens | Blue Jays | 1997 | 21-7 | 11.9 | 2.25 | 222 | 1.030 | 21.5 | CY |
| Randy Johnson | Mariners | 1997 | 20-4 | 8.0 | 2.82 | 197 | 1.052 | 25.2 | |
| Brad Radke | Twins | 1997 | 20-10 | 4.6 | 3.81 | 120 | 1.193 | 17.6 | |
| David Cone | Yankees | 1998 | 20-7 | 4.0 | 3.45 | 125 | 1.180 | 17.3 | |
| Roger Clemens | Blue Jays | 1998 | 20-6 | 8.2 | 2.65 | 174 | 1.095 | 19.0 | CY |
| Rick Helling | Rangers | 1998 | 20-7 | 3.7 | 4.34 | 109 | 1.327 | 9.3 | |
| Pedro Martinez | Red Sox | 1999 | 23-4 | 9.7 | 1.39 | 243 | 0.923 | 33.1 | CY |
| Tim Hudson | Athletics | 2000 | 20-6 | 4.0 | 4.13 | 113 | 1.241 | 10.3 | |
| David Wells | Blue Jays | 2000 | 20-8 | 4.8 | 3.50 | 123 | 1.293 | 13.9 | |
| Mark Mulder | Athletics | 2001 | 21-8 | 5.6 | 3.35 | 126 | 1.156 | 11.0 | |
| Roger Clemens | Yankees | 2001 | 20-3 | 5.6 | 3.29 | 128 | 1.257 | 23.2 | CY |
| Jamie Moyer | Mariners | 2001 | 20-6 | 3.4 | 4.17 | 120 | 1.102 | 8.8 | |
| Barry Zito | Athletics | 2002 | 21-5 | 7.2 | 3.87 | 158 | 1.134 | 11.1 | CY |
| Derek Lowe | Red Sox | 2002 | 21-7 | 7.2 | 3.34 | 177 | 0.974 | 9.2 | |
| Bartolo Colon | Indians/Expos | 2002 | 20-8 | 2.4 | 3.72 | 147 | 1.239 | 14.1 | |
| Pedro Martinez | Red Sox | 2002 | 20-4 | 6.5 | 2.24 | 202 | 0.923 | 25.3 | |
| Roy Halladay | Blue Jays | 2003 | 22-7 | 8.1 | 3.23 | 145 | 1.071 | 16.1 | CY |
| Esteban Loaiza | White Sox | 2003 | 21-9 | 7.2 | 3.05 | 159 | 1.113 | 16.4 | |
| Jamie Moyer | Mariners | 2003 | 21-7 | 4.8 | 4.01 | 132 | 1.233 | 7.0 | |
| Andy Pettitte | Yankees | 2003 | 21-8 | 3.1 | 3.35 | 110 | 1.330 | 14.5 | |
| Curt Schilling | Red Sox | 2004 | 21-6 | 7.9 | 3.11 | 148 | 1.063 | 18.5 | |
| Johan Santana | Twins | 2004 | 21-6 | 8.6 | 2.92 | 182 | 0.921 | 23.9 | CY |
| Bartolo Colon | Angels | 2005 | 21-8 | 4.0 | 3.75 | 122 | 1.159 | 12.6 | CY |
| Josh Beckett | Red Sox | 2007 | 21-8 | 6.5 | 3.08 | 145 | 1.141 | 18.7 | |
| Cliff Lee | Indians | 2008 | 22-3 | 6.9 | 2.83 | 167 | 1.110 | 15.3 | CY |
| Roy Halladay | Blue Jays | 2008 | 20-11 | 6.2 | 3.03 | 152 | 1.053 | 16.9 | |
| Mike Mussina | Yankees | 2008 | 20-9 | 5.2 | 3.32 | 131 | 1.223 | 14.5 | |
| CC Sabathia | Yankees | 2010 | 21-7 | 4.6 | 3.54 | 136 | 1.191 | 12.7 | |
| Justin Verlander | Tigers | 2011 | 24-5 | 8.4 | 2.99 | 172 | 0.920 | 19.9 | CY |
| David Price | Rays | 2012 | 20-5 | 6.9 | 3.05 | 150 | 1.100 | 17.5 | CY |
| Jered Weaver | Angels | 2012 | 20-5 | 4.0 | 3.75 | 135 | 1.018 | 13.1 | |
| Max Scherzer | Tigers | 2013 | 21-3 | 6.7 | 2.74 | 144 | 0.970 | 22.0 | CY |
| Dallas Keuchel | Astros | 2015 | 20-8 | 7.2 | 2.91 | 157 | 1.017 | 18.1 | CY |
| Rick Porcello | Red Sox | 2016 | 22-4 | 5.1 | 3.40 | 142 | 1.009 | 17.6 | CY |
| JA Happ | Blue Jays | 2016 | 20-4 | 4.5 | 3.96 | 134 | 1.169 | 12.9 | |
Here’s what the NL list of 20-game winners looks like:
| PITCHER NAME | TEAM | SEASON | W-L RECORD | WAR | FIP | ERA+ | WHIP | K% – BB% | |
| John Smoltz | Braves | 1996 | 24-8 | 7.3 | 2.64 | 149 | 1.001 | 22.2 | CY |
| Denny Neagle | Braves | 1997 | 20-5 | 4.5 | 3.34 | 140 | 1.084 | 13.0 | |
| Tom Glavine | Braves | 1998 | 20-6 | 6.1 | 3.50 | 168 | 1.203 | 8.9 | CY |
| Mike Hampton | Houston | 1999 | 22-4 | 6.6 | 3.64 | 155 | 1.285 | 7.8 | |
| Jose Lima | Houston | 1999 | 21-10 | 4.5 | 3.76 | 125 | 1.218 | 14.0 | |
| Tom Glavine | Braves | 2000 | 21-9 | 4.9 | 4.03 | 135 | 1.191 | 8.8 | |
| Darryl Kile | Cardinals | 2000 | 20-9 | 3.7 | 4.24 | 120 | 1.175 | 14.0 | |
| Matt Morris | Cardinals | 2001 | 22-8 | 4.1 | 3.05 | 137 | 1.257 | 14.4 | |
| Curt Schilling | Dbacks | 2001 | 22-6 | 8.8 | 3.11 | 157 | 1.075 | 24.9 | |
| Randy Johnson | Dbacks | 2001 | 21-6 | 10.0 | 2.13 | 188 | 1.009 | 30.3 | CY |
| Jon Lieber | Cubs | 2001 | 20-6 | 3.9 | 3.79 | 109 | 1.149 | 11.2 | |
| Randy Johnson | Dbacks | 2002 | 24-5 | 10.9 | 2.66 | 195 | 1.031 | 25.4 | CY |
| Curt Schilling | Dbacks | 2002 | 23-5 | 8.7 | 2.40 | 140 | 0.968 | 27.8 | |
| Bartolo Colon | Indians/Expos | 2002 | 20-8 | 2.4 | 3.72 | 147 | 1.239 | 14.1 | |
| Russ Ortiz | Braves | 2003 | 21-7 | 2.3 | 4.17 | 113 | 1.314 | 5.2 | |
| Roy Oswalt | Astros | 2004 | 20-10 | 4.0 | 3.17 | 124 | 1.245 | 14.6 | |
| Dontrelle Willis | Marlins | 2005 | 22-10 | 7.3 | 2.99 | 152 | 1.134 | 12.0 | |
| Chris Carpenter | Cardinals | 2005 | 21-5 | 5.8 | 2.90 | 150 | 1.055 | 17.0 | |
| Roy Oswalt | Astros | 2005 | 20-12 | 5.9 | 3.16 | 144 | 1.204 | 13.6 | |
| Brandon Webb | Dbacks | 2008 | 22-7 | 5.8 | 3.28 | 140 | 1.196 | 12.5 | |
| Roy Halladay | Phillies | 2010 | 21-10 | 8.3 | 3.01 | 167 | 1.041 | 19.0 | CY |
| Adam Wainwright | Cardinals | 2010 | 20-11 | 6.3 | 2.86 | 160 | 1.051 | 17.3 | |
| Ian Kennedy | Dbacks | 2011 | 21-4 | 4.8 | 3.22 | 137 | 1.086 | 22.0 | |
| Clayton Kershaw | Dodgers | 2011 | 21-5 | 4.7 | 2.47 | 161 | 0.977 | 27.2 | |
| Gio Gonzalez | Nationals | 2012 | 21-8 | 4.9 | 2.82 | 138 | 1.129 | 15.9 | |
| R.A. Dickey | Mets | 2012 | 20-6 | 5.8 | 3.27 | 139 | 1.053 | 19.0 | CY |
| Clayton Kershaw | Dodgers | 2014 | 21-3 | 7.5 | 1.81 | 197 | 0.857 | 31.9 | CY |
| Johnny Cueto | Reds | 2014 | 20-9 | 6.4 | 3.30 | 163 | 0.960 | 18.4 | |
| Adam Wainwright | Cardinals | 2014 | 20-9 | 6.1 | 2.88 | 153 | 1.031 | 19.9 | |
| Jake Arrieta | Cubs | 2015 | 22-6 | 8.7 | 2.35 | 215 | 0.865 | 21.6 | CY |
| Max Scherzer | Nationals | 2016 | 20-7 | 6.2 | 3.24 | 144 | 0.968 | 25.3 | CY |
* You can find more about what these numbers mean HERE
* Blank lines (blacked out in the spreadsheet) indicate no 20-game winners that year
* I showed my work HERE – check it out! (it’s easier to follow along in the sheet)
Pay attention to the 9 seasons listed in red. These are what we’re going to look at to determine the worst 20-win seasons since 1996.
The 9 worst 20-win pitching seasons since 1996 are the following:
- Rick Helling (1998 Rangers), Jose Lima (1999 Astros), Darryl Kile (2000 Cardinals)
- Jamie Moyer (2001 and 2003 Mariners), Jon Lieber (2001 Cubs)
- Andy Pettitte (2003 Yankees), Russ Ortiz (2003 Braves)
- CC Sabathia (2010 Yankees)
Looking at our 5 advanced metrics, I compared the numbers against each other and also against the league averages of those years. I put the bad numbers in red, and the good numbers in green. Those with a lot of green were off the hook, those with a lot of red stayed on my 20-win hot seat. To break ties, I went into every pitcher’s game log and counted how many bad starts they had that year.
Here’s what those 9 seasons looked like:
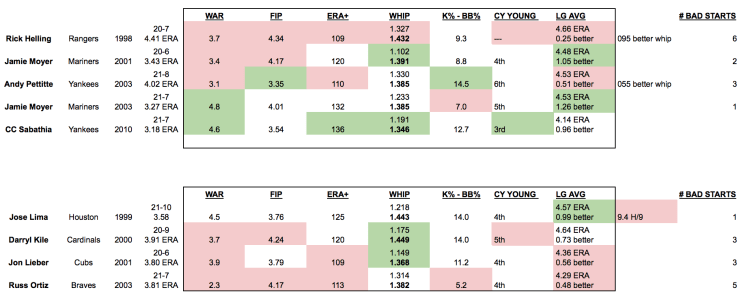
The 5 Finalists For A Dubious Honor
From those 9, I cut it to Helling, Pettitte, Kile, Lieber and Ortiz. In addition to the 5 metrics we already have, I went back to the game logs and looked at game scores, how often each pitcher recorded 20 outs and how their teams fared in their starts vs. when they didn’t pitch. Here’s what the 5 pitchers left look like:

Rick Helling vs. Russ Ortiz
Whenever I think of Rick Helling, I think of 2 things: that he blew the whistle on steroids way before his time and what Chuck Klosterman, one of my favorite authors, said about him:

Today, I think about his 1998 season, where he won 20 games with a mediocre 4.41 ERA. He had 7 starts which I would consider “duds” had an ERA+ of 109 (9% better than league average). On the other hand, Ortiz had 6 “duds” and only got 20 outs a third of the time (12 of his 34 starts).
Here’s the difference: The 1998 Rangers went 25-8 in Helling’s starts (.758), compared to 63-66 in all other games. The 2003 Braves went 24-10 in Ortiz’s starts (.706), but won 101 games because they had an excellent team. The Braves went 77-51 without Ortiz.
Russ Ortiz’s 2003 season with the Braves where he won 21 games is the worst 20-win season in baseball since 1996.
For the record, here’s how I rate the 5 worst 20-game winners: Ortiz 03, Helling 98, Kile 00, Pettitte 03, Lieber 01. Jon Lieber’s only the 5th worst!
The Common Theme In This Exercise: Needles
Other than Sabathia’s “just kinda OK” 2010 season, all of these pitching seasons in question happened between 1998-2003. Look at this list above: 20-game winners before 1998 and after 2006 or so have way better numbers. Guys like Helling, Moyer and Ortiz battled through the Steroid Era and bulldogged their way to wins and quality outings against pharmaceutically-enhanced behemoths.
Winning 20 games from 1998 through 2006 or so is even more impressive when you consider the climate of PEDs in the sport.
The Worst Career Pitcher Who Won 20 Wins
So now that we know 2003 Russ Ortiz is the worst kind of 20-game winner, let’s take a minute and figure out the worst overall player to win 20 since 1996.
In his 13-year career, Jose Lima managed just 6.2 WAR. No other 20-game winner had less than 13.9 career WAR. Lima’s career record was 89-102 and his career ERA+ was 85 (15% worse than an average big leaguer).
Jose Lima is the worst pitcher to win 20 games since 1996 and it’s not anywhere close. The table below shows the career WAR totals for our list of 20-game winners:

He’s Got Jokes
“…in baseball, you wear a cap!”

One thought