I’ve spent a lot of the last 2 years looking at Instagram engagement. I set out for improvement in engagement rate for the athletics account I work on the most and that made me think about what drives people to action on Instagram. So often, you’ll hear people say “We need graphics. Make more graphics!” While there’s certainly a place for those, my findings below will help you simplify your Insta game and also get more engagement from your audience.
Across many accounts over many sports over the last year, I noticed that time spent building complicated graphics and posting them to Instagram was time better spent elsewhere. In fact, great photography by itself seemed to drive fans and followers to action. A simple photo was getting the job done. I took this hunch and ran with it in my current shop, building the following study:
- I collected the engagement data of 831 Insta posts from 8 different accounts related to Ball State from the 2019-20 year (561 graphics, 270 photos). Graphics defined as designed files and photos as standalone photography.
- I categorized each post as photo, photo carousel (multiple images) or a graphic. I ignored videos, as they are measured by Instagram differently.
- Engagements were measured as Likes + Comments.
Instagram Data Analysis Findings
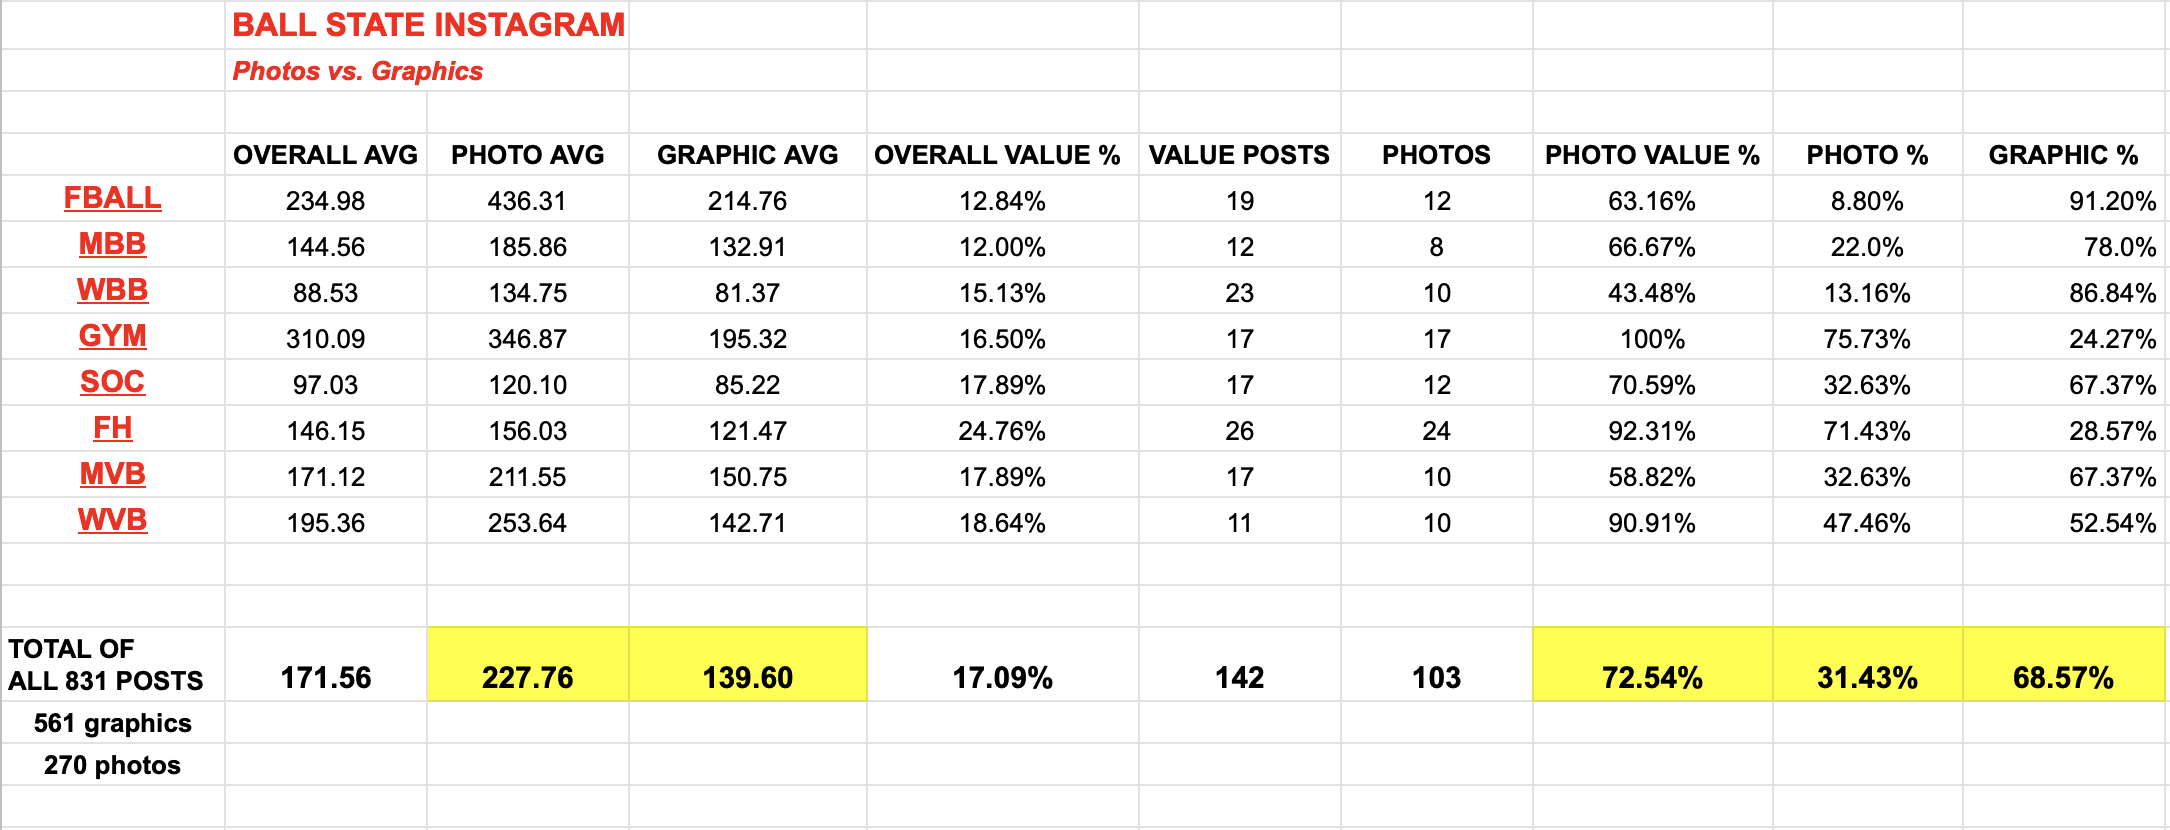
Over 831 Instagram posts across 8 different accounts, my hunch proved correct. Photos outperform graphics from an engagement standpoint by a large margin. The average number of engagements for a photo posted by one of the 8 Ball State accounts I analyzed was 227.76, compared to just 139.60 engagements when a graphic was posted. In short, the number of engagements increased by 63.1% when one of the Ball State accounts posted a photo rather than spending the time and resources building a graphic.
It’s also important to consider the kind of posts are found on each account. Is it all graphics? Just photos? A mix? I also looked at the percentage of photos vs. graphics on each account and found from what I measured across the 8 BSU accounts we were posting photos 31.4% of the time and graphics 68.6% of the time. My feeling is that those numbers are backward, and need to be reversed.
Also, I recorded what I call ‘value posts.’ I set a level of engagement for each account and highlighted each post that met the ‘value post’ standard. Approximately, this is a post that ranked in the top 17% of that account’s engagement for the year. For example, I counted 142 value posts in the Ball State study. That is, 142 of the 831 posts were high-engagement. Of those 142 value posts, 103 of them were standalone photos.
Translation: 72% of the top-performing posts from the study were photos, despite photos only being 31% of the output.
To make a football analogy, if 72% of a team’s best plays on offense were slant routes, wouldn’t you throw more slant routes?
Here’s a recap of the Instagram data:
If you’re interested in seeing the calculations and raw data up close, you can DOWNLOAD MY WORK HERE.
Instagram Data Explanation
Quickly, I wanted to explain the chart above. In the red are the 8 accounts I looked at over a year, totaling 831 Insta posts (561 graphics, 270 photos). Overall Avg is that account’s average number of engagements for each post. Photo Avg is the average engagements for a post contains only standalone photography. Graphic Avg is the average number of engagements for a created graphic.
Overall Value % is the percentage of Insta posts I counted as a ‘value post,’ meaning it performed in the top 1/6th or so in engagements for the year. In short, “what percentage of posts earned a high rate of engagement.” Value Posts is the total number of those high-engagement ‘value posts’ and Photos is the how many of those ‘value posts’ were photography.
Photo Value % is the percentage of value posts that are photos and Photo % and Graphic % show the share of each on the account for the year. For example, Ball State women’s basketball’s account was 13.16% photos, but 43.48% of its highest performers were photos.
So, maybe this is just happening at my place. While each account caters to a different audience, it’s still the same ecosystem of people and everyone’s resources are similar. To further test this hunch, I looked at another Group of 5 school with a comparable profile but in another part of the country. This way, I’d be surveying the behaviors of completely different people with different interests and accounts with different philosophies, opportunities and priorities.
Let’s Try It At Another School
I off the top of my head picked San Jose State. Bigger than Ball State in some areas, smaller in others. A little different, but still Group of 5, and the people out west are going to be much different than the Midwesterners (mainly) that follow the Ball State accounts.
Let’s see if the “use photos and not graphics on Instagram” hunch checks out.
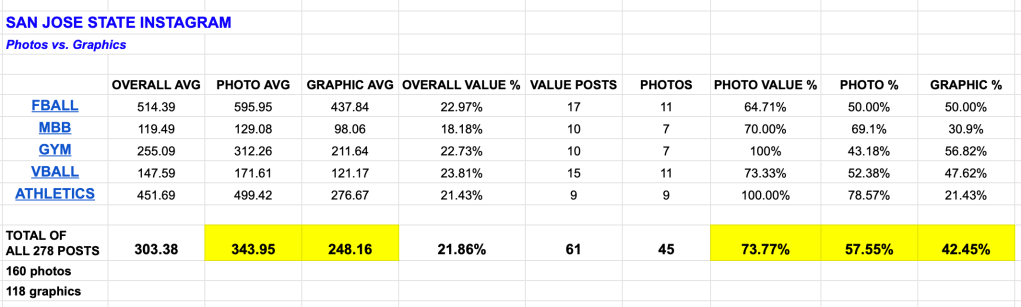
To recap, I looked at 278 posts on 5 of San Jose State’s accounts. No videos – just photos (and carousels) and graphics. You’ll see the engagement averages for photos (343.95) vs. graphics (248.16) were 38.6% higher. Of the 278 posts I looked at, 57.55% of those were standalone photography, yet 73.77% of the top performing posts were photos. I ballparked the threshold for ‘value posts’ and the result was posts in the top 21.86% counted as high-performing.
If you DOWNLOAD MY SAN JOSE STATE DATA HERE, you’ll find I added another metric, called ‘Top Performer.’ These are posts that drew even higher engagement, outliers in the data. I characterized 22 of the 278 posts (7.9%) as ‘Top Performers’ and they’re in gold in the Excel data.
Of the 22 “Top Performers,” 17 were of standalone photography and 5 were graphics. So yeah, posting great photos got the job done across 13 accounts at 2 different schools in different parts of the country.
(FYI, subjectively, I think SJSU does a great job on Instagram)
Takeaways For Instagram Users
- Data is nice, but it’s not the end-all, be-all. What are you trying to achieve?
Data deep dives are useful, but of course they’re not everything. Keep your objectives in mind, but I stand by the idea that if I can drive my audience to take action, I’ve reached them. Seeing what’s driving people to action will help you know how to make an impact for your brand/team/business. - Good graphic design is still very valuable.
This goes without saying. While I’ve found across 13 different Instagram accounts at 2 different schools that posting great photos will help you get more engagement while saving more time on Instagram, a great graphic still has its place. In the chart above, you’ll see Ball State gymnastics’ account is 75.7% photos and 24.3% graphics. That ratio seems right to me, maybe it’ll work for you. Also, a clean graphic clearly communicating a big award or important win can be useful. - Put your best photography in your Instagram feed.
How do you want to be perceived? What photos tell the story you want to tell? Put those in your Instagram feed. Better yet, put 4-5 great photos in a carousel and tell your story with 5,000 words. As Michael Scott told Dwight Shrute…

4. Think about how you use/consume Instagram as an individual.
When you’re on your own personal Instagram, are you posting carefully-manicured graphics? What are your friends posting? Largely, the goal is to make your brand/team/business “friends” with your audience. Use Instagram like your audience uses it.
To recap, Instagram users can save time and will probably gain more engagement in their feed by posting photos. Save graphics for when the strategically make sense. Look at your numbers and see if these trends are tracking for your accounts. After a long event, post the best pics from the day and watch those numbers grow.
End With A Joke
If you watched Schitt’s Creek, you know this song. I love that show and this fan video is tremendous.
